Building Real-Time Charts With GraphQL And Postgres

Email Newsletter
Weekly tips on front-end & UX.
Trusted by 200,000+ folks.

 Register!
 Flexible CMS. Headless & API 1st


Charts form an integral part of any industry that deals with data. Charts are useful in the voting and polling industry, and they’re also great at helping us better understand the different behaviors and characteristics of the users and clients we work with.
Why are real-time charts so important? Well, they’re useful in cases when new data is produced continuously; for example, when using live-time series for visualizing stock prices is a great use for real-time charts. In this tutorial, I’ll explain how to build real-time charts with open-source technologies apt for exactly this particular task.
Note: This tutorial requires basic knowledge of React and GraphQL.
Stack
- PostgreSQL
The very point behind using Charts is to visualize “huge” volumes data. We, therefore, need a database that efficiently handles large data and provides an intuitive API to restructure it. SQL databases allow us to make views that abstract and aggregate data for us. We will be using Postgres which is a time-tested and highly efficient database. It also has fancy open-source extensions like Timescale and PostGIS which allow us to build geolocation-based and time-series-based charts respectively. We will be using Timescale for building our time series chart. - GraphQL Engine
This post is about building real-time charts, and GraphQL comes with a well-defined spec for real-time subscriptions. Hasura GraphQL Engine is an open-source GraphQL server that takes a Postgres connection and allows you to query the Postgres data over realtime GraphQL. It also comes with an access control layer that helps you restrict your data based on custom access control rules. - ChartJS
ChartJS is a popular and well maintained open source library for building charts with JavaScript. We will usechart.jsalong with its ReactJS abstractionreact-chartjs-2. About why React, it is because React empowers developers with an intuitive event-driven API. Also, React’s unidirectional data flow is ideal for building charts that are data-driven.
Requirements
For this tutorial, you will need the following on your system:
- Docker CE
Docker is a software that lets you containerize your applications. A docker image is an independent packet that contains software along with its dependencies and a minimalistic operating system. Such docker images can be technically run in any machine that has docker installed. You will need docker for this tutorial. - npm: npm is the package manage for JavaScript.
Demo
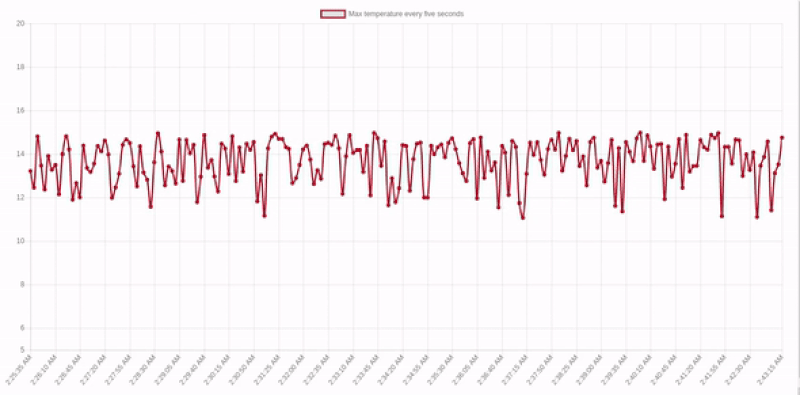
We will build the following live time series chart that shows the maximum temperature of a location in intervals of 5 seconds over the past 20 minutes from the present moment.
Setting Up The Backend
Running The Services
The backend comprises of a Postgres database, its timescale extension, and Hasura GraphQL Engine. Let us get the database and our GraphQL server running by running the respective docker images. Create a file called docker-compose.yaml and paste this content into it.
Note: docker-compose is a utility to run multiple docker images declaratively.
version: '2'
services:
  timescale:
    image: timescale/timescaledb:latest-pg10
    restart: always
    environment:
      POSTGRES_PASSWORD: postgrespassword
    volumes:
    - db_data:/var/lib/postgresql/data
  graphql-engine:
    image: hasura/graphql-engine:v1.0.0-alpha38
    ports:
    - "8080:8080"
    depends_on:
    - "timescale"
    restart: always
    environment:
      HASURA_GRAPHQL_DATABASE_URL: postgres://postgres:postgrespassword@timescale:5432/postgres
      HASURA_GRAPHQL_ACCESS_KEY: mylongsecretkey
    command:
      - graphql-engine
      - serve
      - --enable-console
volumes:
  db_data:
This docker-compose.yaml contains the spec for two services:
timescale
This is our Postgres database with Timescale extension installed. It is configured to run at port 5432.graphql-engine
This is our Hasura GraphQL Engine instance, i.e. the GraphQL server that points to the database and gives GraphQL APIs over it. It is configured to run at the port 8080, and the port 8080 is mapped to the port 8080 of the machine that this docker container runs on. This means that you can access this GraphQL server through atlocalhost:8080of the machine.
Let’s run these docker containers by running the following command wherever you have placed your docker-compose.yaml.
docker-compose up -d
This command pulls the docker images from the cloud and runs them in the given order. It might take a few seconds based on your internet speed. Once it is complete, you can access your GraphQL Engine console at https://localhost:8080/console.
Setting Up The Database
Next, let us create a table called temperature that stores the values of temperatures at different times. Go to the Data tab in the console and go to the SQL section. Create our temperature table by running this SQL block:
CREATE TABLE temperature (
  temperature numeric not null,
  location text not null,
  recorded_at timestamptz not null default now()
);
This creates a simple Postgres table in the database. But we wish to leverage the time interval partitioning of the Timescale extension. To do this, we must convert this table into timescale’s hypertable by running the SQL command:
SELECT create_hypertable('temperature', 'recorded_at');
This command creates a hypertable that is partitioned by time in the field recorded_at.
Now, since this table is created, we can directly start making GraphQL queries over it. You can try them out by clicking on the GraphiQL tab on top. Try making a mutation first:
mutation {
  insert_temperature (
    objects: [{
      temperature: 13.4
      location: "London"
    }]
  ) {
    returning {
      recorded_at
      temperature
    }
  }
}
The GraphQL mutation above inserts a row in the temperature table. Now try to make a GraphQL query to check if the data was inserted.
Then try making a query:
query {
  temperature {
    recorded_at
    temperature
    location
  }
}
Hope it worked :)
Now, the task at our hand is to create a live time-series chart that shows the maximum temperature of a location in intervals of 5 seconds over the past 20 minutes from the present moment. Let’s create a view that gives us exactly this data.
CREATE VIEW last_20_min_temp AS (
  SELECT time_bucket('5 seconds', recorded_at) AS five_sec_interval,
  location,
    MAX(temperature) AS max_temp
  FROM temperature
  WHERE recorded_at > NOW() - interval '20 minutes'
  GROUP BY five_sec_interval, location
  ORDER BY five_sec_interval ASC
);
This view groups the data from the temperature table in 5-second windows with their max temperature (max_temp). The secondary grouping is done using the location field. All this data is only from the past twenty minutes from the present moment.
That’s it. Our backend is set up. Let us now build a nice real-time chart.
Frontend
Hello GraphQL Subscriptions
GraphQL subscriptions are essentially “live” GraphQL queries. They operate over WebSockets and have exactly the same response structure like GraphQL queries. Go back to https://localhost:8080/console and try to make a GraphQL subscription to the view we created.
subscription {
  last_20_min_temp(
    order_by: {
      five_sec_interval: asc
    }
    where: {
      location: {
        _eq: "London"
      }
    }
  ) {
    five_sec_interval
    location
    max_temp
  }
}
This subscription subscribes to the data in the view where the location is London and it is ordered in ascending order of the five_second_intervals.
Naturally, the response from the view would be an empty array because we have not inserted anything in the database in the past twenty minutes. (You might see the entry that we inserted sometime back if you reached this section within twenty minutes.)
{
  "data": {
    "last_20_min_temp": []
  }
}
Keeping this subscription on, open another tab and try inserting another value in the temperatures table using the same mutation that we performed earlier. After inserting, if you go back to the tab where the subscription was on, you would see the response having updated automatically. That’s the realtime magic that GraphQL Engine provides. Let’s use this subscription to power our real-time chart.
Getting Started With Create-React-App
Let us quickly get started with a React app starter using create react app. Run the command:
npx create-react-app time-series-chart
This will create an empty starter project. cd into it and install the GraphQL and chart libraries. Also, install moment for converting timestamps to a human-readable format.
cd time-series-chart
npm install --save apollo-boost apollo-link-ws subscriptions-transport-ws graphql react-apollo chart.js react-chartjs-2 moment
Finally, run the app with npm start and a basic React app would open up at https://localhost:3000.
Setting Up Apollo Client For Client-Side GraphQL
Apollo client is currently the best GraphQL client that works with any GraphQL compliant server. Relay modern is good too but the server must support the relay spec to leverage all the benefits of Relay modern. We’ll use Apollo client for client-side GraphQL for this tutorial. Let us perform the setup to provide Apollo client to the app.
I am not getting into the subtleties of this setup because the following code snippets are taken directly from the docs. Head to src/index.js in the React app directory and instantiate Apollo client and add this code snippet above ReactDOM.render.
import { WebSocketLink } from 'apollo-link-ws';
import { ApolloClient } from 'apollo-client';
import { ApolloProvider } from 'react-apollo';
import { InMemoryCache } from 'apollo-cache-inmemory';

// Create a WebSocket link:
const link = new WebSocketLink({
  uri: `ws://localhost:8080/v1alpha1/graphql`,
  options: {
    reconnect: true,
    connectionParams: {
      headers: {
        "x-hasura-admin-secret: "mylongsecretkey"
      }
    }
  }
})
const cache = new InMemoryCache();
const client = new ApolloClient({
  link,
  cache
});
Finally, wrap the App inside ApolloProvider so that we can use Apollo client in the children components. Your App.js should finally look like:
import React from 'react';
import ReactDOM from 'react-dom';
import './index.css';
import App from './App';
import { WebSocketLink } from 'apollo-link-ws';
import { ApolloClient } from 'apollo-client';
import { ApolloProvider } from 'react-apollo';
import { InMemoryCache } from 'apollo-cache-inmemory';

// Create a WebSocket link:
const link = new WebSocketLink({
  uri: `ws://localhost:8080/v1alpha1/graphql`,
  options: {
    reconnect: true,
    connectionParams: {
      headers: {
        "x-hasura-admin-secret: "mylongsecretkey"
      }
    }
  }
})
const cache = new InMemoryCache();
const client = new ApolloClient({
  link,
  cache
});

ReactDOM.render(
  (
    <ApolloProvider client={client}>
      <App />
    </ApolloProvider>
  ),
  document.getElementById('root')
);
Apollo client has been set up. We can now easily use real-time GraphQL from our App. Head to src/App.js.
Building The Chart
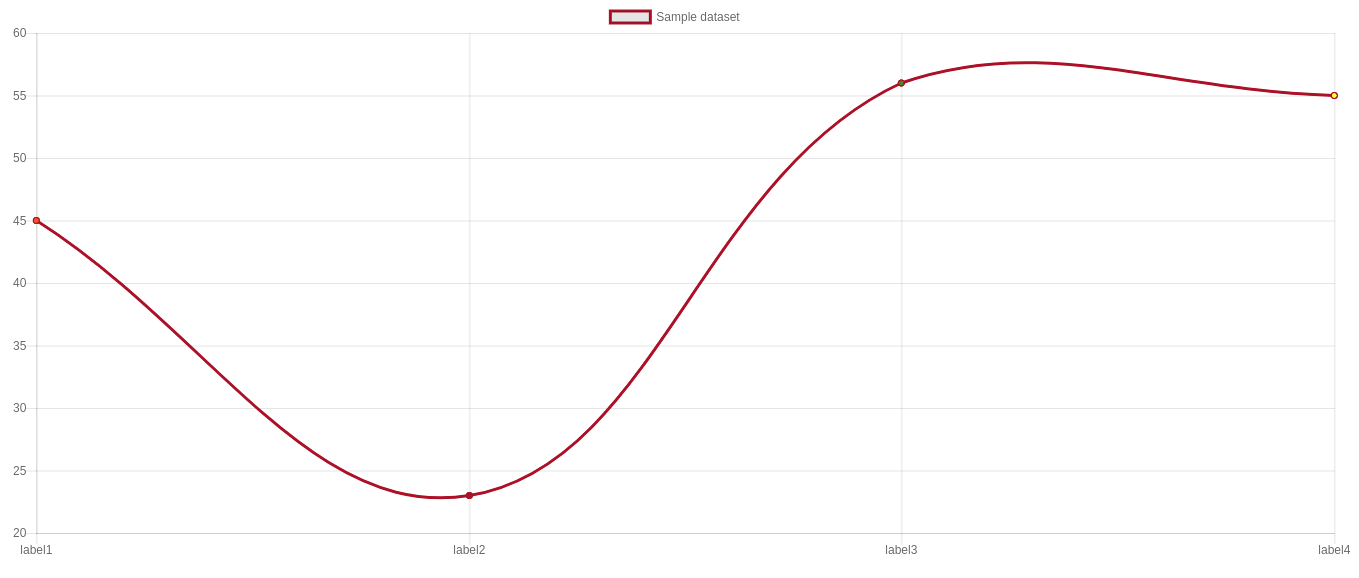
ChartJS provides a pretty neat API for building charts. We will be building a line chart; so a line chart expects data of the form:
{
  "labels": ["label1", "label2", "label3", "label4"],
  "datasets": [{
    "label": "Sample dataset",
    "data": [45, 23, 56, 55],
    "pointBackgroundColor": ["red", "brown", "green", "yellow"],
    "borderColor": "brown",
    "fill": false
  }],
}
If the above dataset is used for rendering a line chart, it would look something like this:
Let us try to build this sample chart first. Import Line from react-chartjs-2 and render it passing the above object as a data prop. The render method would look something like:
render() {
  const data = {
    "labels": ["label1", "label2", "label3", "label4"],
    "datasets": [{
      "label": "Sample dataset",
      "data": [45, 23, 56, 55],
      "pointBackgroundColor": ["red", "brown", "green", "yellow"],
      "borderColor": "brown",
      "fill": false
    }],
  }
  return (
    <div
      style={{display: 'flex', alignItems: 'center', justifyContent: 'center', margin: '20px'}}
    >
      <Line
        data={data}
      />
    </div>
  );
}
Next, we will subscribe to the data in our view and feed it to the Line chart. But how do we perform subscriptions on the client?
Apollo’s <Subscription> components work using the render prop pattern where the children of a component are rendered with the context of the subscription data.
<Subscription
  subscription={gql`subscription { parent { child } }`}
/>
  {
    ({data, error, loading}) => {
      if (error) return <Error error={error} />;
      if (loading) return <Loading />;
      return <RenderData data={data} />;
    }
  }
</Subscription>
Let us use one such Subscription component to subscribe to our view and then transform the subscription data to the structure that ChartJS expects. The transforming logic looks like this:
let chartJSData = {
  labels: [],
  datasets: [{
    label: "Max temperature every five seconds",
    data: [],
    pointBackgroundColor: [],
    borderColor: 'brown',
    fill: false
  }]
};
data.last_20_min_temp.forEach((item) => {
  const humanReadableTime = moment(item.five_sec_interval).format('LTS');
  chartJSData.labels.push(humanReadableTime);
  chartJSData.datasets[0].data.push(item.max_temp);
  chartJSData.datasets[0].pointBackgroundColor.push('brown');
})
Note: You can also use the open-source library graphq2chartjs for transforming the data from GraphQL response to a form that ChartJS expects.
After using this inside the Subscription component, our App.js looks like:
import React, { Component } from 'react';
import { Line } from 'react-chartjs-2';
import { Subscription } from 'react-apollo';
import gql from 'graphql-tag';
import moment from 'moment';

const TWENTY_MIN_TEMP_SUBSCRIPTION= gql'
  subscription {
    last_20_min_temp(
      order_by: {
        five_sec_interval: asc
      }
      where: {
        location: {
          _eq: "London"
        }
      }
    ) {
      five_sec_interval
      location
      max_temp
    }
  }
'

class App extends Component {
  render() {
    return (
      <div
        style={{display: 'flex', alignItems: 'center', justifyContent: 'center', margin: '20px'}}
      >
        <Subscription subscription={TWENTY_MIN_TEMP_SUBSCRIPTION}>
          {
            ({data, error, loading}) => {
              if (error) {
                console.error(error);
                return "Error";
              }
              if (loading) {
                return "Loading";
              }
              let chartJSData = {
                labels: [],
                datasets: [{
                  label: "Max temperature every five seconds",
                  data: [],
                  pointBackgroundColor: [],
                  borderColor: 'brown',
                  fill: false
                }]
              };
              data.last_20_min_temp.forEach((item) => {
                const humanReadableTime = moment(item.five_sec_interval).format('LTS');
                chartJSData.labels.push(humanReadableTime);
                chartJSData.datasets[0].data.push(item.max_temp);
                chartJSData.datasets[0].pointBackgroundColor.push('brown');
              })
              return (
                <Line
                  data={chartJSData}
                  options={{
                    animation: {duration: 0},
                    scales: { yAxes: [{ticks: { min: 5, max: 20 }}]}
                  }}
                />
              );
            }
          }
        </Subscription>
      </div>
    );
  }
}

export default App;
You will have a fully working real-time chart ready at https://localhost:3000 . However, it would be empty, so let’s populate some sample data so we can actually see some magic happen.
Note: I have added some more options to the Line chart because I don’t like those fancy animations in ChartJS. A time series looks sweet when it’s simple, however, you can remove the options prop if you like.
Inserting Sample Data
Lets write a script that populates our database with dummy data. Create a separate directory (outside this app) and create a file called script.js with the following content,
const fetch = require('node-fetch');
setInterval(
  () => {
    const randomTemp = (Math.random() * 5) + 10;
    fetch(
      `https://localhost:8080/v1alpha1/graphql`,
      {
        method: 'POST',
        body: JSON.stringify({
          query: `
            mutation ($temp: numeric) {
              insert_temperature (
                objects: [{
                  temperature: $temp
                  location: "London"
                }]
              ) {
                returning {
                  recorded_at
                  temperature
                }
              }
            }
          `,
          variables: {
            temp: randomTemp
          }
        })
      }
    ).then((resp) => resp.json().then((respObj) => console.log(JSON.stringify(respObj, null, 2))));
  },
  2000
);
Now run these two commands:
npm install --save node-fetch
node script.js
You can go back to https://localhost:3000 and see the chart updating.
Finishing Up
You can build most of the real-time charts using the ideas that we discussed above. The algorithm is:
- Deploy GraphQL Engine with Postgres;
- Create tables where you wish to store data;
- Subscribe to those tables from your React app;
- Render the chart.
You can find the source code here.


