A Quick Look Into The Math Of Animations With JavaScript

Email Newsletter
Weekly tips on front-end & UX.
Trusted by 200,000+ folks.

 Flexible CMS. Headless & API 1st

 Register!
In school, I hated math. It was a dire, dry and boring thing with stuffy old books and very theoretical problems. Even worse, a lot of the tasks were repetitive, with a simple logical change in every iteration (dividing numbers by hand, differentials, etc.). It was exactly the reason why we invented computers. Suffice it to say, a lot of my math homework was actually done by my trusty Commodore 64 and some lines of Basic, with me just copying the results later on.
These tools and the few geometry lessons I had gave me the time and inspiration to make math interesting for myself. I did this first and foremost by creating visual effects that followed mathematical rules in demos, intros and other seemingly pointless things.
There is a lot of math in the visual things we do, even if we don’t realize it. If you want to make something look natural and move naturally, you need to add a bit of physics and rounding to it. Nature doesn’t work in right angles or linear acceleration. This is why zombies in movies are so creepy. This was covered here before in relation to CSS animation, but today let’s go a bit deeper and look at the simple math behind the smooth looks.
Going From 0 To 1 Without Being Boring
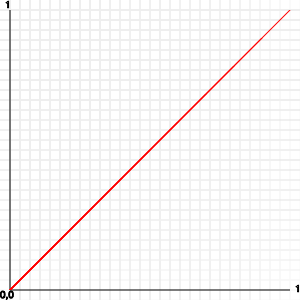
If you’ve just started programming and are asked to go from 0 to 1 with a few steps in between, you would probably go for a for loop:
for ( i = 0; i <= 1; i += 0.1 ) {
  x = i;
  y = i;
…
}
This would result in a line on a graph that is 45 degrees. Nothing in nature moves with this precision:
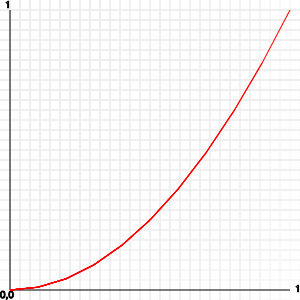
A simple way to make this movement a bit more natural would be to simply multiply the value by itself:
for ( i = 0; i <= 1; i += 0.1 ) {
  x = i;
  y = i * i;
}
This means that 0.1 is 0.01, 0.2 is 0.04, 0.3 is 0.09, 0.4 is 0.16, 0.5 is 0.25 and so on. The result is a curve that starts flat and then gets steeper towards the end:
You can make this even more pronounced by continuing to multiply or by using the “to the power of” Math.pow() function:
for ( i = 0; i <= 1; i += 0.1 ) {
  x = i;
  y = Math.pow( i, 4 );
}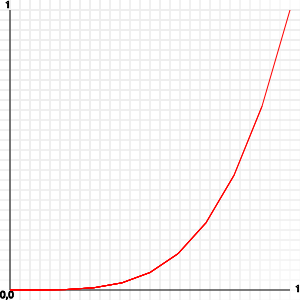
This is one of the tricks of the easing functions used in libraries such as jQuery and YUI, as well as in CSS transitions and animations in modern browsers.
You can use this the same way, but there is an even simpler option for getting a value between 0 and 1 that follows a natural motion.
Not A Sin, Just A Natural Motion
Sine waves are probably the best thing ever for smooth animation. They happen in nature: witness a spring with a weight on it, ocean waves, sound and light. In our case, we want to move from 0 to 1 smoothly.
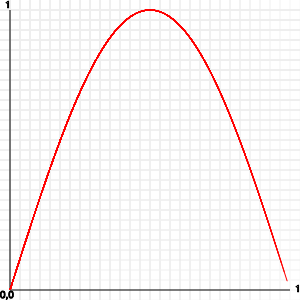
To create a movement that goes from 0 to 1 and back to 0 smoothly, we can use a sine wave that goes from 0 to π in a few steps. The full sine wave going from 0 to π × 2 (i.e. a whole circle) would result in values from -1 to 1, and we don’t want that (yet).
var counter = 0;

// 100 iterations
var increase = Math.PI / 100;

for ( i = 0; i <= 1; i += 0.01 ) {
  x = i;
  y = Math.sin(counter);
  counter += increase;
}
A quick aside on numbers for sine and cosine: Both Math.sin() and Math.cos() take as the parameter an angle that should be in radians. As humans, however, degrees ranging from 0 to 360 are much easier to read. That’s why you can and should convert between them with this simple formula:
var toRadian = Math.PI / 180;
var toDegree = 180 / Math.PI;

var angle = 30;

var angleInRadians = angle * toRadian;
var angleInDegrees = angleInRadians * toDegree;
Back to our sine waves. You can play with this a lot. For example, you could use the absolute value of a full 2 × π loop:
var counter = 0;
// 100 iterations
var increase = Math.PI * 2 / 100;

for ( i = 0; i <= 1; i += 0.01 ) {
  x = i;
  y = Math.abs( Math.sin( counter ) );
  counter += increase;
}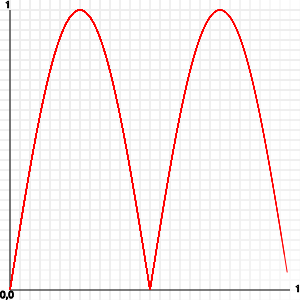
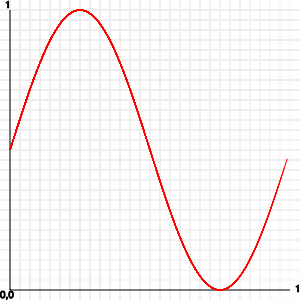
But again, this looks dirty. If you want the full up and down, without a break in the middle, then you need to shift the values. You have to half the sine and then add 0.5 to it:
var counter = 0;
// 100 iterations
var increase = Math.PI * 2 / 100;

for ( i = 0; i <= 1; i += 0.01 ) {
  x = i;
  y = Math.sin( counter ) / 2 + 0.5;
  counter += increase;
}
So, how can you use this? Having a function that returns -1 to 1 to whatever you feed it can be very cool. All you need to do is multiply it by the values that you want and add an offset to avoid negative numbers.
For example, check out this sine movement demo:

Looks neat, doesn’t it? A lot of the trickery is already in the CSS:
.stage {
  width:200px;
  height:200px;
  margin:2em;
  position:relative;
  background:#6cf;
  overflow:hidden;
}

.stage div {
  line-height:40px;
  width:100%;
  text-align:center;
  background:#369;
  color:#fff;
  font-weight:bold;
  position:absolute;
}
The stage element has a fixed dimension and is positioned relative. This means that everything that is positioned absolutely inside it will be relative to the element itself.
The div inside the stage is 40 pixels high and positioned absolutely. Now, all we need to do is move the div with JavaScript in a sine wave:
var banner = document.querySelector( '.stage div' ),
    start = 0;
function sine(){
  banner.style.top = 50 * Math.sin( start ) + 80 + 'px';
  start += 0.05;
}
window.setInterval( sine, 1000/30 );
The start value changes constantly, and with Math.sin() we get a nice wave movement. We multiply this by 50 to get a wider wave, and we add 80 pixels to center it in the stage element. Yes, the element is 200 pixels high and 100 is half of that, but because the banner is 40 pixels high, we need to subtract half of that to center it.
Right now, this is a simple up-and-down movement. Nothing stops you, though, from making it more interesting. The multiplying factor of 50, for example, could be a sine wave itself with a different value:
var banner = document.querySelector( '.stage div' ),
start = 0,
multiplier = 0;
function sine(){
multiplier = 50 * Math.sin( start * 2 );
banner.style.top = multiplier * Math.sin( start ) + 80 + 'px';
start += 0.05;
}
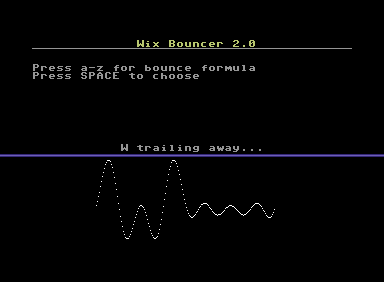
window.setInterval( sine, 1000/30 );The result of this is a banner that seems to tentatively move up and down. Back in the day and on the very slow Commodore 64, calculating the sine wave live was too slow. Instead, we had tools to generate sine tables (arrays, if you will), and we plotted those directly. One of the tools for creating great sine waves so that you could have bouncing scroll texts was the Wix Bouncer:
Circles In The Sand, Round And Round…
Circular motion is a thing of beauty. It pleases the eye, reminds us of spinning wheels and the earth we stand on, and in general has a “this is not computer stuff” feel to it. The math of plotting something on a circle is not hard.
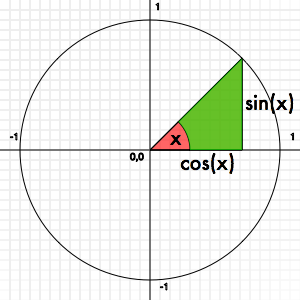
It goes back to Pythagoras, who, as rumor has it, drew a lot of circles in the sand until he found his famous theorem. If you want to use all the good stuff that comes from this theorem, then try to find a triangle with a right angle. If this triangle’s hypothenuse is 1, then you can easily calculate the horizontal leg as the cosine of the angle and the vertical leg as the sine of the angle:
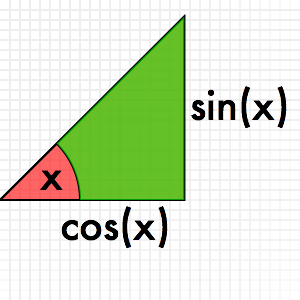
How is this relevant to a circle? Well, it is pretty simple to find a right-angle triangle in a circle to every point of it:
This means that if you want to plot something on a circle (or draw one), you can do it with a loop and sine and cosine. A full circle is 360°, or 2 × π in radians. We could have a go at it — but first, some plotting code needs to be done.
A Quick DOM Plotting Routine
Normally, my weapon of choice here would be canvas, but in order to play nice with older browsers, let’s do it in plain DOM. The following helper function adds div elements to a stage element and allows us to position them, change their dimensions, set their color, change their content and rotate them without having to go through the annoying style settings on DOM elements.
Plot = function ( stage ) {

  this.setDimensions = function( x, y ) {
    this.elm.style.width = x + 'px';
    this.elm.style.height = y + 'px';
    this.width = x;
    this.height = y;
  }
  this.position = function( x, y ) {
    var xoffset = arguments[2] ? 0 : this.width / 2;
    var yoffset = arguments[2] ? 0 : this.height / 2;
    this.elm.style.left = (x - xoffset) + 'px';
    this.elm.style.top = (y - yoffset) + 'px';
    this.x = x;
    this.y = y;
  };
  this.setbackground = function( col ) {
    this.elm.style.background = col;
  }
  this.kill = function() {
    stage.removeChild( this.elm );
  }
  this.rotate = function( str ) {
    this.elm.style.webkitTransform = this.elm.style.MozTransform =
    this.elm.style.OTransform = this.elm.style.transform =
    'rotate('+str+')';
  }
  this.content = function( content ) {
    this.elm.innerHTML = content;
  }
  this.round = function( round ) {
    this.elm.style.borderRadius = round ? '50%/50%' : ’;
  }
  this.elm = document.createElement( 'div' );
  this.elm.style.position = 'absolute';
  stage.appendChild( this.elm );

};
The only things that might be new here are the transformation with different browser prefixes and the positioning. People often make the mistake of creating a div with the dimensions w and h and then set it to x and y on the screen. This means you will always have to deal with the offset of the height and width. By subtracting half the width and height before positioning the div, you really set it where you want it — regardless of the dimensions. Here’s a proof:
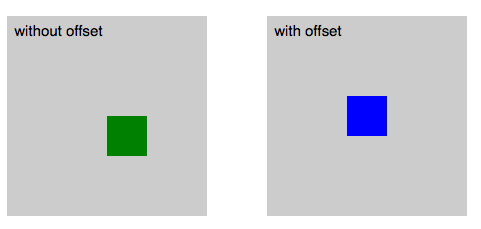
Now, let’s use that to plot 10 rectangles in a circle, shall we?
var stage = document.querySelector('.stage'),
plots = 10;
increase = Math.PI * 2 / plots,
angle = 0,
x = 0,
y = 0;
for( var i = 0; i < plots; i++ ) {
var p = new Plot( stage );
p.setBackground( 'green' );
p.setDimensions( 40, 40 );
x = 100 * Math.cos( angle ) + 200;
y = 100 * Math.sin( angle ) + 200;
p.position( x, y );
angle += increase;
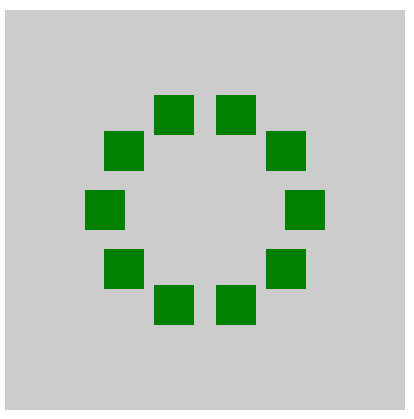
}We want 10 things in a circle, so we need to find the angle that we want to put them at. A full circle is two times Math.PI, so all we need to do is divide this. The x and y position of our rectangles can be calculated by the angle we want them at. The × is the cosine, and the y is the sine, as explained earlier in the bit on Pythagoras. All we need to do, then, is center the circle that we’re painting in the stage (200,200 is the center of the stage), and we are done. We’ve painted a circle with a radius of 100 pixels on the canvas in 10 steps.
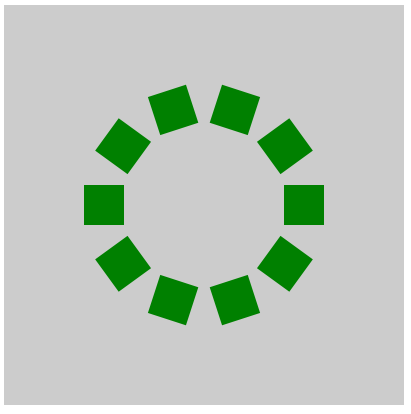
The problem is that this looks terrible. If we really want to plot things on a circle, then their angles should also point to the center, right? For this, we need to calculate the tangent of the right-angle square, as explained in this charming “Math is fun” page. In JavaScript, we can use Math.atan2() as a shortcut. The result looks much better:
var stage = document.querySelector('.stage'),
    plots = 10;
    increase = Math.PI * 2 / plots,
    angle = 0,
    x = 0,
    y = 0;

for( var i = 0; i < plots; i++ ) {
  var p = new Plot( stage );
  p.setBackground( 'green' );
  p.setDimensions( 40, 40 );
  x = 100 * Math.cos( angle ) + 200;
  y = 100 * Math.sin( angle ) + 200;
  p.rotate( Math.atan2( y - 200, x - 200 ) + 'rad' );
  p.position( x, y );
  angle += increase;
}
Notice that the rotate transformation in CSS helps us heaps in this case. Otherwise, the math to rotate our rectangles would be much less fun. CSS transformations also take radians and degrees as their value. In this case, we use rad; if you want to rotate with degrees, simply use deg as the value.
How about animating the circle now? Well, the first thing to do is change the script a bit, because we don’t want to have to keep creating new plots. Other than that, all we need to do to rotate the circle is to keep increasing the start angle:
var stage = document.querySelector('.stage'),
    plots = 10;
    increase = Math.PI * 2 / plots,
    angle = 0,
    x = 0,
    y = 0,
    plotcache = [];

for( var i = 0; i < plots; i++ ) {
  var p = new Plot( stage );
  p.setBackground( 'green' );
  p.setDimensions( 40, 40 );
  plotcache.push( p );
}

function rotate(){
  for( var i = 0; i < plots; i++ ) {
    x = 100 * Math.cos( angle ) + 200;
    y = 100 * Math.sin( angle ) + 200;
    plotcache[ i ].rotate( Math.atan2( y - 200, x - 200 ) + 'rad' );
    plotcache[ i ].position( x, y );
    angle += increase;
  }
  angle += 0.06;
}

setInterval( rotate, 1000/30 );
Want more? How about a rotating text message based on this? The tricky thing about this is that we also need to turn the characters 90° on each iteration:
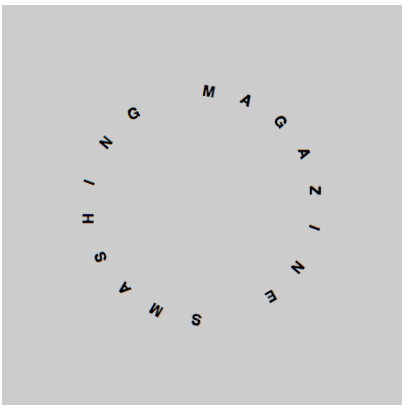
var stage = document.querySelector('.stage'),
    message = 'Smashing Magazine '.toUpperCase(),
    plots = message.length;
    increase = Math.PI * 2 / plots,
    angle = -Math.PI,
    turnangle = 0,
    x = 0,
    y = 0,
    plotcache = [];

for( var i = 0; i < plots; i++ ) {
  var p = new Plot( stage );
  p.content( message.substr(i,1) );
  p.setDimensions( 40, 40 );
  plotcache.push( p );
}
function rotate(){
  for( var i = 0; i < plots; i++ ) {
    x = 100 * Math.cos( angle ) + 200;
    y = 100 * Math.sin( angle ) + 200;
    // rotation and rotating the text 90 degrees
    turnangle = Math.atan2( y - 200, x - 200 ) * 180 / Math.PI + 90 + 'deg';
    plotcache[ i ].rotate( turnangle );
    plotcache[ i ].position( x, y );
    angle += increase;
  }
  angle += 0.06;
}

setInterval( rotate, 1000/40 );
Again, nothing here is fixed. You can make the radius of the circle change constantly, as we did with the bouncing banner message earlier (below is only an excerpt):
multiplier = 80 * Math.sin( angle );
for( var i = 0; i < plots; i++ ) {
  x = multiplier * Math.cos( angle ) + 200;
  y = multiplier * Math.sin( angle ) + 200;
  turnangle = Math.atan2( y - 200, x - 200 ) * 180 / Math.PI + 90 + 'deg';
  plotcache[ i ].rotate( turnangle );
  plotcache[ i ].position( x, y );
  angle += increase;
}
angle += 0.06;
And, of course, you can move the center of the circle, too:
rx = 50 * Math.cos( angle ) + 200;
ry = 50 * Math.sin( angle ) + 200;
for( var i = 0; i < plots; i++ ) {
  x = 100 * Math.cos( angle ) + rx;
  y = 100 * Math.sin( angle ) + ry;
  turnangle = Math.atan2( y - ry, x - rx ) * 180 / Math.PI + 90 + 'deg';
  plotcache[ i ].rotate( turnangle );
  plotcache[ i ].position( x, y );
  angle += increase;
}
angle += 0.06;
For a final tip, how about allowing only a certain range of coordinates?
function rotate() {
  rx = 70 * Math.cos( angle ) + 200;
  ry = 70 * Math.sin( angle ) + 200;
  for( var i = 0; i < plots; i++ ) {
    x = 100 * Math.cos( angle ) + rx;
    y = 100 * Math.sin( angle ) + ry;
    x = contain( 70, 320, x );
    y = contain( 70, 320, y );
    turnangle = Math.atan2( y - ry, x - rx ) * 180 / Math.PI + 90 + 'deg';
    plotcache[ i ].rotate( turnangle );
    plotcache[ i ].position( x, y );
    angle += increase;
  }
  angle += 0.06;
}
function contain( min, max, value ) {
  return Math.min( max, Math.max( min, value ) );
}
Summary
This was just a quick introduction to using exponentials and sine waves and to plotting things on a circle. Have a go with the code, and play with the numbers. It is amazing how many cool effects you can create with a few changes to the radius or by multiplying the angles. To make it easier for you to do this, below are the examples on JSFiddle to play with:
- Sine bouncing message
- Double sine bouncing message
- Offset issue with plotting
- Distributing elements on a circle
- Distributing elements on a circle with correct angles
- Rotating a circle of boxes
- Oscillating rotating message
- Rotating message in a circle movement
- Boxed rotated message scroller
Further Reading
- SVG and CSS animations with clip-path
- Creating ‘hand-drawn’ Animations With SVG
- The new Web Animation API
- Practical Animation Techniques
- UI Animation Guidelines and Examples
- Designing Animations In Photoshop
- Fast Prototyping UI Animations In Keynote


